| Report: Downtime Reason Breakdown | Print page Close window |
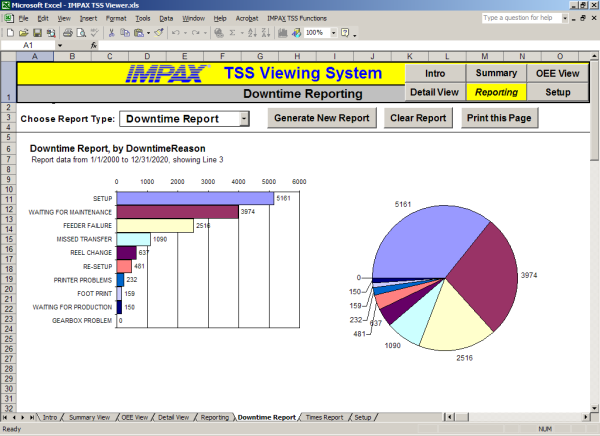
Understanding the reasons for downtime is the first step towards increasing productivity. To help with this, TSS-NET offers a powerful visual downtime analysis tool. All occurrences of downtime are tracked by the system, and they can be easily displayed by selecting the machines to examine along with a date range. This brings up a visual representation of all downtime experienced, in a Pareto-style graph, and a pie chart. At a glance, the leading causes of unproductivity can be determined, and managers can immediately see how each potential problem contributes to machine downtime. Once the bottleneck reasons have been identified, it's now easy to justify spending the time and resources required to fix these problems before they cause any more issues.

View IMPAX TSS-NET Screenshots:
- Machine Status and Production
- Production Speed (PPM) and Efficiency
- Uptime and Downtime Minutes and Percents
- Downtime Occurrences and Response Times
- Current Job Information
- Tool Usage Counts and Maintenance Task Counts
- Overall Equipment Effectiveness (OEE)
- Report: Downtime Reason Breakdown
- Report: Uptime vs. Downtime Analysis
- Report: Custom Data Table
- Exporting Data
- Machine Scheduling